Temperature mapping is one of the most critical — and most misunderstood — activities in pharmaceutical quality assurance. Get it wrong and you face regulatory observations, product losses and potential patient-safety risks. Get it right and you have documented evidence that your storage conditions protect your products.
This guide covers everything you need: from the regulatory framework, to sensor placement, to writing a report that will survive an FDA or EMA inspection.
What is temperature mapping?
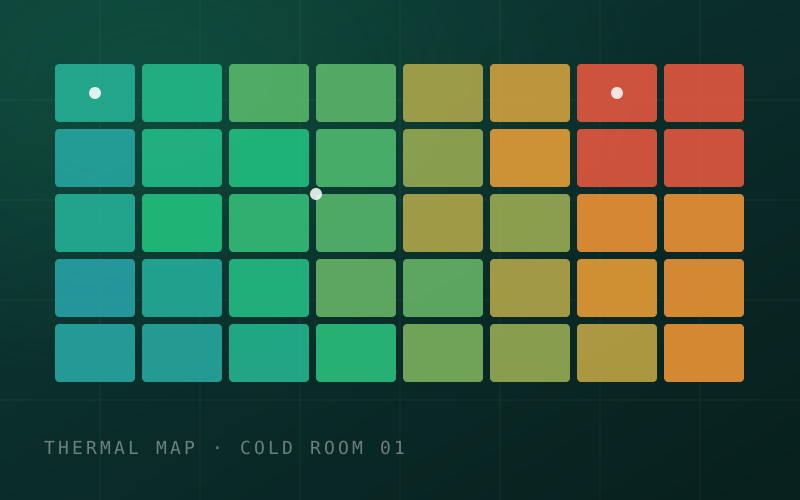
Temperature mapping — also called thermal mapping or temperature-distribution study — is a systematic exercise to characterise the temperature distribution within a controlled storage environment over time. The goal is to identify hot spots, cold spots and areas of variation, and to demonstrate that your entire storage space maintains the required range.
For pharmaceutical products this is not optional. It is a regulatory requirement under GDP guidelines, GMP Annex 1 and WHO technical reports. It applies to warehouses, cold rooms, refrigerators, freezers and vehicles.
Before you start: the mapping protocol
Every mapping study must be preceded by a written protocol, approved before the study begins. This is non-negotiable — running a study without a pre-approved protocol is a common inspection failure. Your protocol must define the study objective, scope and boundaries, sensor-placement rationale, number of sensors required, data-logger specifications, study duration and season, acceptable temperature ranges, and criteria for deviation investigation.
How many sensors do you need?
This is the most common question, and the answer depends on room size and risk profile. The WHO guidelines provide a starting framework:
- Small rooms under 50 m²: minimum 9 sensors
- Medium rooms of 50–300 m²: minimum 15 sensors
- Large warehouses over 300 m²: minimum 15, plus 1 per additional 100 m²
- Additional sensors near doors, air-handling units, loading docks, external walls, and at floor and ceiling level
Sensor placement: the critical positions
Sensor placement is where most mapping studies fail. Placing sensors in a uniform grid tells you about the middle of the room — you need to map the extremes.
- Near every door: opening and closing creates the biggest fluctuations
- Near air-handling units: both supply and return air zones
- At floor and ceiling level: temperature stratifies vertically
- Near external walls: especially south-facing walls in summer studies
- Near loading docks and receiving areas
Study duration and seasonality
A single mapping study is not enough. GDP guidelines require mapping under worst-case seasonal conditions — both a summer study (highest ambient) and a winter study (lowest ambient). Minimum duration is typically 7 consecutive days, covering normal operational activities including goods receipt and picking.
Common failures that attract observations
- Only one seasonal study conducted (summer only)
- No protocol approved before the study began
- Insufficient sensors — particularly near doors and loading areas
- Data loggers not calibrated within 12 months of the study
- No risk assessment to justify sensor placement
- Study conducted when the building was empty or non-operational
- No documented requalification trigger criteria
Get the full 37-point checklist
Download our free GDP temperature-mapping checklist — every requirement in this guide and more.
Get new guides by email
Practical monitoring, mapping and calibration guides, straight to your inbox. No spam — unsubscribe anytime.